Database Parallelism Overview
The title of this post contains the word “Practical” for a reason. At INFOLOB, we see hundreds of Exadata platforms every year and in most cases, Database Parallelism is not configured optimally. There seems to be a consensus that more is better, more parallelism, that is. It’s like having a headache and knowing that two asprin makes you feel better, so maybe 200 will take care of that headache right away! It might, but it will probably kill you in the process. The same goes for Database Parallelism.
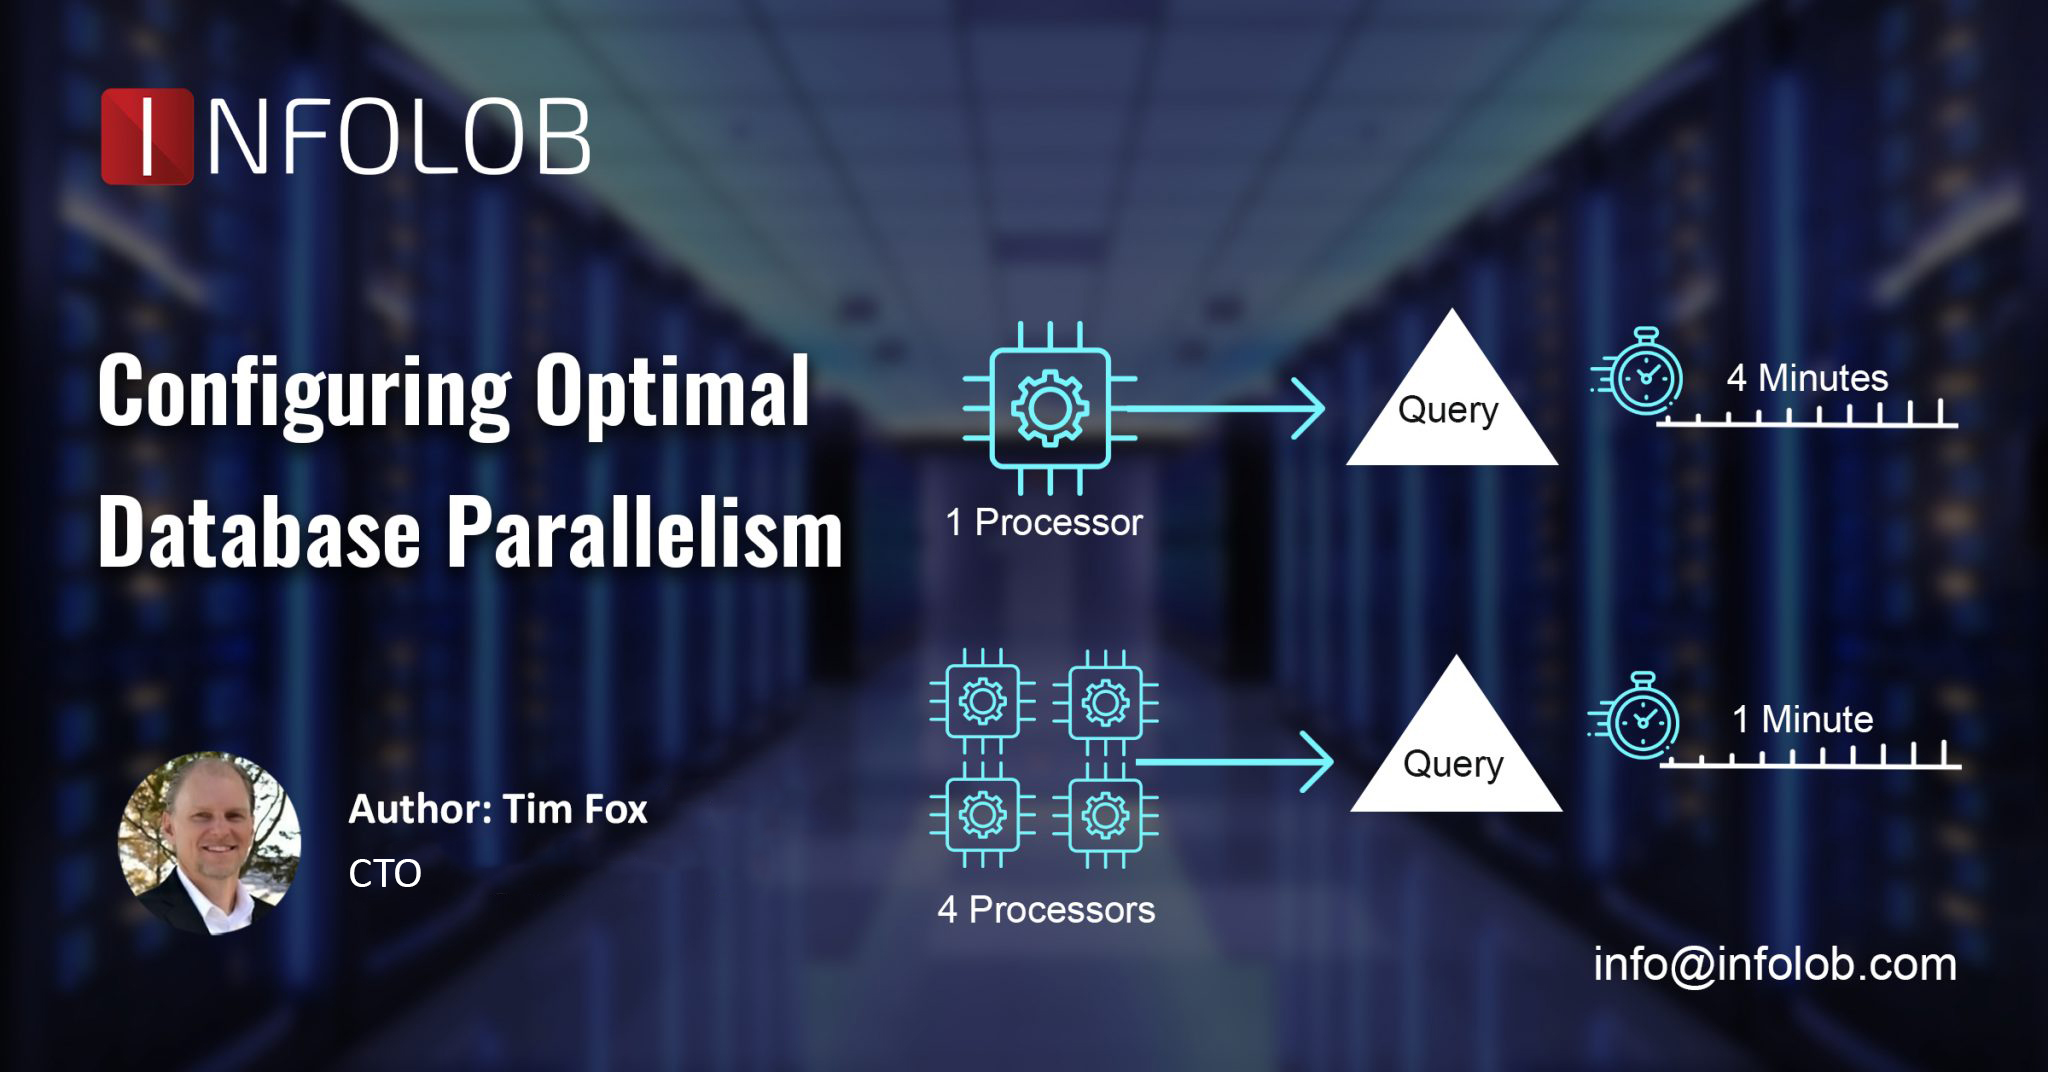
The “Practical” component of Database Parallelism is this: CPU Count Matters. If you are running your workload on an Exadata Quarter Rack with 24 cores active per node, setting your PARALLEL_MAX_SERVERS parameter to 256 (per node) might not be the right move. Remember that each Parallel Server (we’ll call them PXS for short) that runs on your system is just like another “you.” Each PXS that shows up on your system requires a logon just like a regular user. In addition, each PXS is allocated PGA just like your session (we’ll get more into PGA in a minute).
So, if you set your PARALLEL_MAX_SERVERS = 256 per node, you’re saying, “I’m confident that my 48 cores (24 active per node) can handle 512 concurrent database sessions (256 per node).” Remember that this is ONLY for PXS sessions. You might also have many other applications or people also logged in to your database. In reality, it may be Ok to use this kind of configuration because we’re only talking about CPU resources. Most workloads are not 100% CPU-focused, some actually perform IO’s too!
Customer Case Study
Now that the stage is set regarding Database Parallelism, I can describe a situation I ran into with a customer. Their configuration was as described above, Exadata X7-2 Quarter Rack with 24 cores active per node. Their Database Parallel settings, however, looked like this (remember, this is per-node):
PARALLEL_DEGREE_POLICY = MANUAL
PARALLEL_FORCE_LOCAL = FALSE
PARALLEL_MIN_SERVERS = 256
PARALLEL_MAX_SERVERS = 2048

So, what was the problem? Poor performance, according to the database team. My first thought, before even looking at the workload, was that the Database Parallel settings were too high. To get a feel for how things are going on any Oracle database, I asked to look at an AWR report from a time period when performance was “poor.” In the report I received, I looked for “parallel operations downgraded” and to my astonishment, about 40% of the thousands of parallel queries that were run were “downgraded to serial.”
What this meant was that the workload was requesting more than 2048 PXS at the same time (on each node!) and the database had to “downgrade” many of the statements to Serial execution. Remember, this was a two node RAC with 24 cores per node. This presented two major problems:
- The Compute Nodes were being asked to support more than 2048 PXS simultaneously (10x more sessions than CPUs)
- Many queries which were optimized to run in Parallel were actually running in Serial
Because this workload was running on Exadata, the negative effects were amplified. When a query runs in Parallel, it (almost) always uses Direct Path Read which is a requirement for an Exadata Smart Scan. When a query is downgraded to Serial, not only is parallelism lost, but often so are Smart Scans. In general, this system was overloaded due to the Database Parallelism configuration.
When Database Parallelism appears to be the problem, locating the source of parallel queries is crucial. In this case, a few key tables and indexes, which were present in almost every query, had been “decorated” with a parallel attribute (DEGREE = 24). Because Oracle uses the Producer / Consumer model for parallel execution, asking for 24 PXS results in 48 (24 Producers and 24 Consumers). Since this workload was generated by hundreds of users, the number of concurrent, and consequently, parallel queries was very high. As the number of queries ramped up, they consumed more of the PXS and available CPU resources and the entire system began to slow down. As queries ran longer, concurrency increased until all of the PXS were consumed and downgrading began. Keep in mind that this workload is referring only to the parallelized queries, not all of the queries on the system.
The Solution
After reviewing the workload characteristics and the parallel settings, the initial solution became clear – Database Parallelism had to be reduced. The customer noted that Database Parallelism was required based on previous testing, so we assumed we had to maintain this feature, but needed to introduce some levels of control. To test the theory, Database Parallelism was implemented at the session level using the following settings:
- ALTER SESSION FORCE PARALLEL QUERY PARALLEL 4
The Alter Session setting overrides the object-level definition so our testing could be done in isolation without changing any permanent parameters. Our methodology is to enable parallelism minimally and ramping up the Degree of Parallelism (DOP) gently only when necessary. With a DOP of 4, performance was good, but slightly below the customer’s baseline. The session DOP was then set to 8 which provided adequate performance based on expectations, but this was for a single session only.
To prove the theory completely, a Logon Trigger was enabled which contained the Alter Session setting shown above, but with a DOP of 8 and for a specific Consumer Group. When new logons were done, the new DOP was applied to all queries in that session. While the workload was running, the v$px_process view was monitored to establish the maximum number of in-use PXS. The result was that queries finished faster because they were not oversubscribing the CPU resources and the maximum number of concurrent PXS never exceeded 256.
The Measurable Outcomes
- CPU Utilization was dramatically reduced – down 40%
- Smart Scan frequency increased further, reducing dependency on Compute Node CPU resources
- Queries finished faster than before the changes were made
- Customer satisfaction increased as a result
Based on this analysis and testing, the customer realized that just because you can parallelize to any degree you want, it doesn’t mean that you should. It became clear that during the Customer’s initial testing with a DOP of 24, a few concurrent queries did not stress the database infrastructure. As the number of concurrent users increased, so did the performance issues. With the ability to manage Database Parallelism at either the object or session level, the customer can now manage PXS with granularity all the way down to the Consumer Group if desired. This type of detailed information can also be used in the future to configure a Database Resource Management Plan (DBRM) and / or an IO Resource Management (IORM) to enable additional controls.
For any and all queries, drop us a message on:


